Q1. A student has got the following scores in his tests: 87, 95, 76, and 88. He wants average of 85 or better overall. What is the minimum score he must get on the last test in order to achieve that average?
Solution
The unknown score is "x". The desired average = 85 So,  Multiplying through by 5 and simplifying, 87 + 95 + 76 + 88 + x = 425 346 + x = 425 x = 79
Multiplying through by 5 and simplifying, 87 + 95 + 76 + 88 + x = 425 346 + x = 425 x = 79
Q2. The mean of first five odd numbers is
Solution
First five odd numbers are 1, 3, 5, 7, 9
The mean of first five odd numbers is =  Therefore, the mean is 5.
Therefore, the mean is 5.
Q3. Which of the following is an example of primary data?
Solution
Data collected from a group of 40 students is an example of primary data.
Q4.  See the double bar graph and answer the question that follows.
Total number of boys and girls participated in Canoeing?
See the double bar graph and answer the question that follows.
Total number of boys and girls participated in Canoeing?
See the double bar graph and answer the question that follows.
Total number of boys and girls participated in Canoeing?Solution
Number of boys participated in Canoeing = 20
Number of girls participated in Canoeing = 15
Thus, total number of boys and girls participated in Canoeing = 20 + 15 = 35
Q5. The following bar graph shows voting results of the colour preference of students.  (a) How many students chose blue as their favorite color? (b) How many more students chose green than red? (c) How many more students voted for purple than red? (d) Do any two colors have the same number of votes? (e) How many students chose purple? (f) If three more students voted for green, how many votes would green have?
(a) How many students chose blue as their favorite color? (b) How many more students chose green than red? (c) How many more students voted for purple than red? (d) Do any two colors have the same number of votes? (e) How many students chose purple? (f) If three more students voted for green, how many votes would green have?Solution
(a) 30 students chose blue as their favorite color. (b) Number of students who chose green color = 45
Number of students who chose red color = 25
Thus, 45 - 25 = 20 more students chose green color than red color. (c) Number of students who voed for purple color = 60
Number of students who voted for red color = 25
Thus, 60 - 25 = 35 more students chose purple color than red color.
35 (d) No two colors have the same number of votes. (e) 60 students chose purple color. (f) There are 45 students who voted for green color. If three more students vote for it, then green color will have 45 + 3 = 48 votes.
Q6. The line graph shows Julie's test results over half a term.  In which week, she showed maximum improvement?
In which week, she showed maximum improvement?Solution
Julie showed maximum improvement in week 4 as her marks in week 3 were 4 and marks in week 4 were 7, i.e., the she showed improvement of 3 marks.
Q7. Given below is a double bar graph representing total number of boys and girls in class IX-A to IX-D.  Which section has maximum number of students?
Which section has maximum number of students?Solution
Number of students in
IX-A = 10 + 12 = 22
IX-B = 25 + 20 = 45
IX-C = 18 + 12 =30
IX-D = 15 + 25 = 40
Thus, IX-B has the maximum number of students.
Q8. The temperature of 4 cities are given in the table below.  Which city has the maximum temperature?
Which city has the maximum temperature?Solution
Delhi has the maximum temperature of 43.
Q9. One card is drawn from a pack of 52 cards, each of the 52 cards being equally likely to be drawn. Find the probability that the card drawn is a picture card excluding the clown card.
-
1)

-
2)

-
3)

-
4)

Solution
A deck of 52 playing cards contains 12 picture cards - 4 jack cards, 4 queen cards and 4 king cardsTotal number of cards = 52
Probability of a picture card = 
Q10. Consider the following data showing runs scored by 11 players in a cricket match:1, 4, 6, 7, 0, 10, 5, 8, 12, 8, 87 This data is termed as
Solution
Unorganized data also called as raw data.
Q11. Arrange the following data in ascending order of marks obtained out of 25 in Math by students in the year 2014.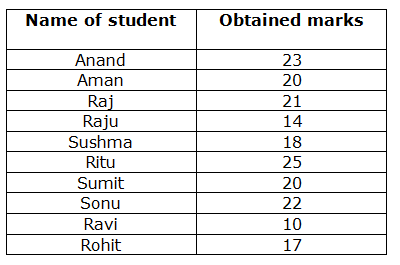 Which student got the highest marks?
Which student got the highest marks?Solution
Data arranged in ascending order of marks is as follows:
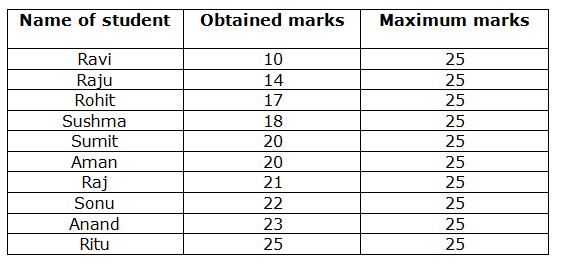 Thus, Ritu got the highest marks i.e. 25 out of 25.
Thus, Ritu got the highest marks i.e. 25 out of 25.
Q12. There are 20 pens in a box. Nine are yellow, 4 are black and 7 are green. What's the probability that a pen which is taken from the box without looking will be green?
-
1)
-
2)

-
3)

-
4)

Solution
Total number of pens = 20
Number of green pens = 7
Hence, Probability (Green pen) = 
Q13. Below are the number of goals scored in 1998 by the top five scorers on each of three National hockey League teams. Use this information to complete the chart.
Team
Goals
Goals
Goals
Goals
Goals
Mean
Median
Mode
India
35
25
30
19
19
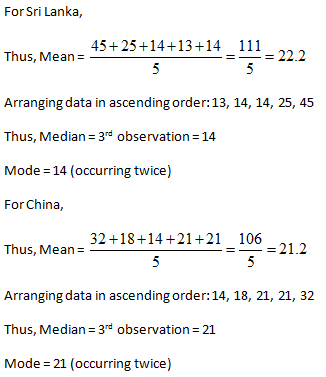
Sril Lanka
45
25
14
13
14
China
32
18
14
21
21
Solution
Team
Goals
Goals
Goals
Goals
Goals
Mean
Median
Mode
India
35
25
30
19
19
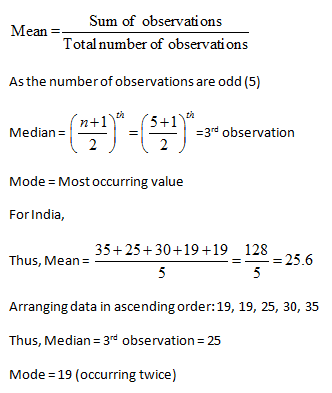
25.6
25
19
Sri Lanka
45
25
14
13
14
22.2
14
14
China
32
18
14
21
21
21.2
21
21
Calculation is as follows:
Q14. Following are the marks scored by students in an English test worth 45 marks.31, 26, 23, 26, 33, 34, 32, 33, 33, 37, 33, 54, 30, 45, 25The mode of the data is _______ .
Solution
Mode is the most occuring value and from above data, 33 is the most occuring value.
Q15. Two bowlers, Srinath and Akhtar, played six games with the following results:
Bowler
Game 1
Game 2
Game 3
Game 4
Game 5
Game 6
Srinath
185
135
200
185
250
155
Akhtar
182
185
188
185
180
190
What are the mean scores for Srinath and Akhtar?
Solution
For Srinath:Mean 
 For Akhtar: Mean
For Akhtar: Mean
Q16. Two bowlers, Srinath and Akhtar, played six games with the following results:
Bowler
Game 1
Game 2
Game 3
Game 4
Game 5
Game 6
Srinath
185
135
200
185
250
155
Akhtar
182
185
188
185
180
190
What are the median and mode scores for Srinath? What are the median and mode scores for Akhtar?
Solution
Srinath: The numbers in order: 135, 155, 185, 185, 200, 250 Since, the number of observations is even, Median is the mean of the middle two values. So, median = Mean of 185 and 185 = 185 Mode is the observation that appears most often. Here, 185 appears twice. So, Mode is 185. Akhtar: The numbers in order: 180, 182, 185, 185, 188, 190 Since, the number of observations is even, Median is the mean of the middle two values. So, median = Mean of 185 and 185 = 185 So, median = 185 Mode is the observation that appears most often. Here, 185 appear twice. So, Mode is 185.
Q17. The mean and median of the following list of values are:8, 9, 10, 10, 10, 11, 11, 11, 12, 13
Solution

Q18. Consider Standard VII of a school. There are four sections in class VII of a school as follows:
Standard VII-A has 10 girls and 12 boys.
Standard VII-B has 6 girls and 20 boys.
Standard VII-C has 18 girls and 12 boys.
Standard VII-D has 16 girls and 24 boys. (a) Tabulate the above data. (b) Count the total number of boys and girls from each section.
Solution
This data can be represented in a tabular form as shown below:
Q19. In a cricket match, the runs scored by 11 players are as follows 12, 23, 10, 77, 15, 78, 90, 54, 23, 10, 1 Find the average score.
Solution
Average score 

Q20. The birth weight of several babies was recorded as shown in the table below. Construct a bar graph to visually display this data.
Baby
Weight (lbs)
Charlie
6.9
Dennis
8.1
Joan
7.9
Lori
6.2
Matthew
9.4
Sarah
10.5
Solution
The units are weight in lbs. The greatest value is 10.5 and the least value is 6.9 Using graph paper, start with 1 box = 1 unit. Mark each rectangle along the scale. Label the marks by the units they represent. Then decide how wide each bar should be. In the graph above, each grid line going from bottom to top represents a multiple of 0.5. Each small rectangle in the graph below represents 0.5 units. So to draw a vertical bar that represents 6.9 lbs, divide 6.9 by 0.5. Your quotient is a bar height of 13.8 rectangles. Thus the bar for Charlie is 13.8 rectangles in height (and represents 6.9 lbs). To draw a bar that represents 10.5 lbs, divide 10.5 by 0.5. Your quotient is a bar height of 21 rectangles. Thus the bar for Sarah is 21 rectangles in height (and represents 10.5 lbs).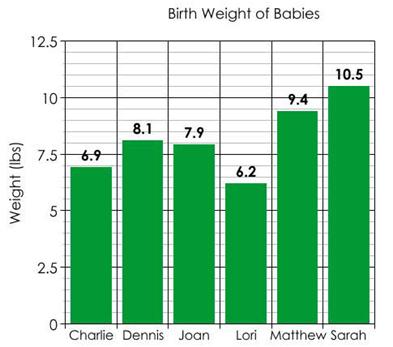
Q21. A bag has 12 balls colored yellow, blue, green and red. The number of balls of each colour is the same. A ball is drawn from the bag. Calculate the probability of drawing a yellow ball, a blue ball, a green ball and a red ball.
Solution
Total number of balls = 12
It is also given that the bag contains equal number of balls of each of the four colours (yellow, blue, green and red).
Therefore,
Number of yellow balls = Number of blue balls = Number of green balls = Number of red balls = 3P(yellow) =  P(blue) =
  P(green) =
  P(red) =
Q22. 25 students were followed from age 14 to age 18 to record how many of these students worked at each age level. The following is the data that was collected: 14 yrs: 1 worked, 24 did not work 15 yrs: 3 worked, 22 did not work 16 yrs: 11 worked, 14 did not work 17 yrs: 19 worked, 6 did not work 18 yrs: 22 worked, 3 did not work Represent the above data using a double bar graph.
Solution
 Step 1: We draw two perpendicular lines OX and OY. Step 2: On OX, we represent ages and on OY we represent the number of student. Step 3: On OY, we start with 0 and mark points at equal intervals of 5. Step 4: The height of the bars are calculated according to the number of students.
Q23. A coin is tossed 100 times in which head is obtained 40 times. On tossing the coin at random ,find the probability of getting head and tail.
Solution
We have Total number of trials = 100 Number of times a head comes up = 40 Number of times a tail comes up = 100 - 40 = 60 Hence , probability of getting a head =  probability of getting a tail =
Comments
Post a Comment